Passive Detection of Medication Non-Adherence in Routine Health Care Operations
Judged member calls at a health plan and a provider organization show non-adherence on 8.6% and 5.6% of calls

%20(2).png)
Executive Summary
Adherence to long-term therapy for chronic disease remains a significant challenge: a 2021 meta-analysis estimated that approximately 43% of people living with two or more chronic conditions were non-adherent to their medications [4]. Non-optimized medication therapy, with non-adherence at its core, was estimated to cost the United States about $528 billion in 2016 [5]. The three proportion-of-days-covered adherence measures are triple-weighted in CMS’s 2026 Part D Star Ratings [8,9]. Yet the prevailing detection channel, the pharmacy claim, is retrospective, blind to cause, and blind to prescriptions that are never filled at all [9,18]. Popai instead analyzes the conversations a health care organization is already having. At a health plan (the payer) and a provider organization (the provider), a random sample of 2,000 medication-mentioning calls each was individually judged for genuine non-adherence against a fixed rubric, with a verbatim transcript excerpt backing every determination [1,2,3].
Highlights
1. Background
Medication non-adherence is a first-order quality and cost lever in managed care: among Medicare beneficiaries it is associated with a 1.0 to 1.7 percentage-point higher probability of a potentially preventable hospitalization or emergency visit [7], and in 2021 about 1 in 12 U.S. adults aged 18-64 taking a prescription medication reported not taking it as prescribed to save money [6]. CMS's Part D Star Ratings score three adherence measures as proportion of days covered (PDC) at 80% or above, each at weight 3 in the 2026 ratings [8,9]. The prevailing detection mechanism, the pharmacy claim, is retrospective and blind to cause: a plan learns of a gap well after it began and cannot tell a copay problem from a prescriber who never sent the renewal. Meanwhile, the same members are in continuous contact with the organization, booking appointments, arranging transportation, and often calling about the very medication in question. Those recorded conversations routinely contain the member's own account of the gap and its cause, yet no capture point exists inside them; unless a human acts on it in the moment, the disclosure ends when the call does.
2. Methods
Two organizations were studied, a health plan (the payer) and a provider organization (the provider), each with an extract of roughly 100,000 de-identified member-call transcripts; eligible calls had a populated team identifier and lasted over 60 seconds. From each, a random sample of 2,000 calls (fixed seed) was drawn from eligible calls that mention a medication, per a high-recall bilingual English/Spanish pre-filter covering 75.2% of the payer's and 78.3% of the provider's eligible calls; calls it does not capture are counted as containing no non-adherence in the all-call estimates. Each sampled call was read in full and judged against a fixed, conservative rubric: a routine refill confirmation or a passing mention does not count; genuine non-adherence requires that the member is not taking a prescribed medication as directed, has run out, cannot obtain it, has stopped, or faces an active barrier keeping them off it (prescribed supplies count as part of the therapy). Confirmed cases were classified by primary reason, medication and clinical severity, and stated gap duration. Judgment was performed by large-language-model analysts, with borderline calls defaulted to negative; every determination stores a verbatim excerpt verified as an exact substring of the transcript, which confirms the quote, not the classification (Appendix C).
3. Results
3.1 Prevalence in the routine call stream
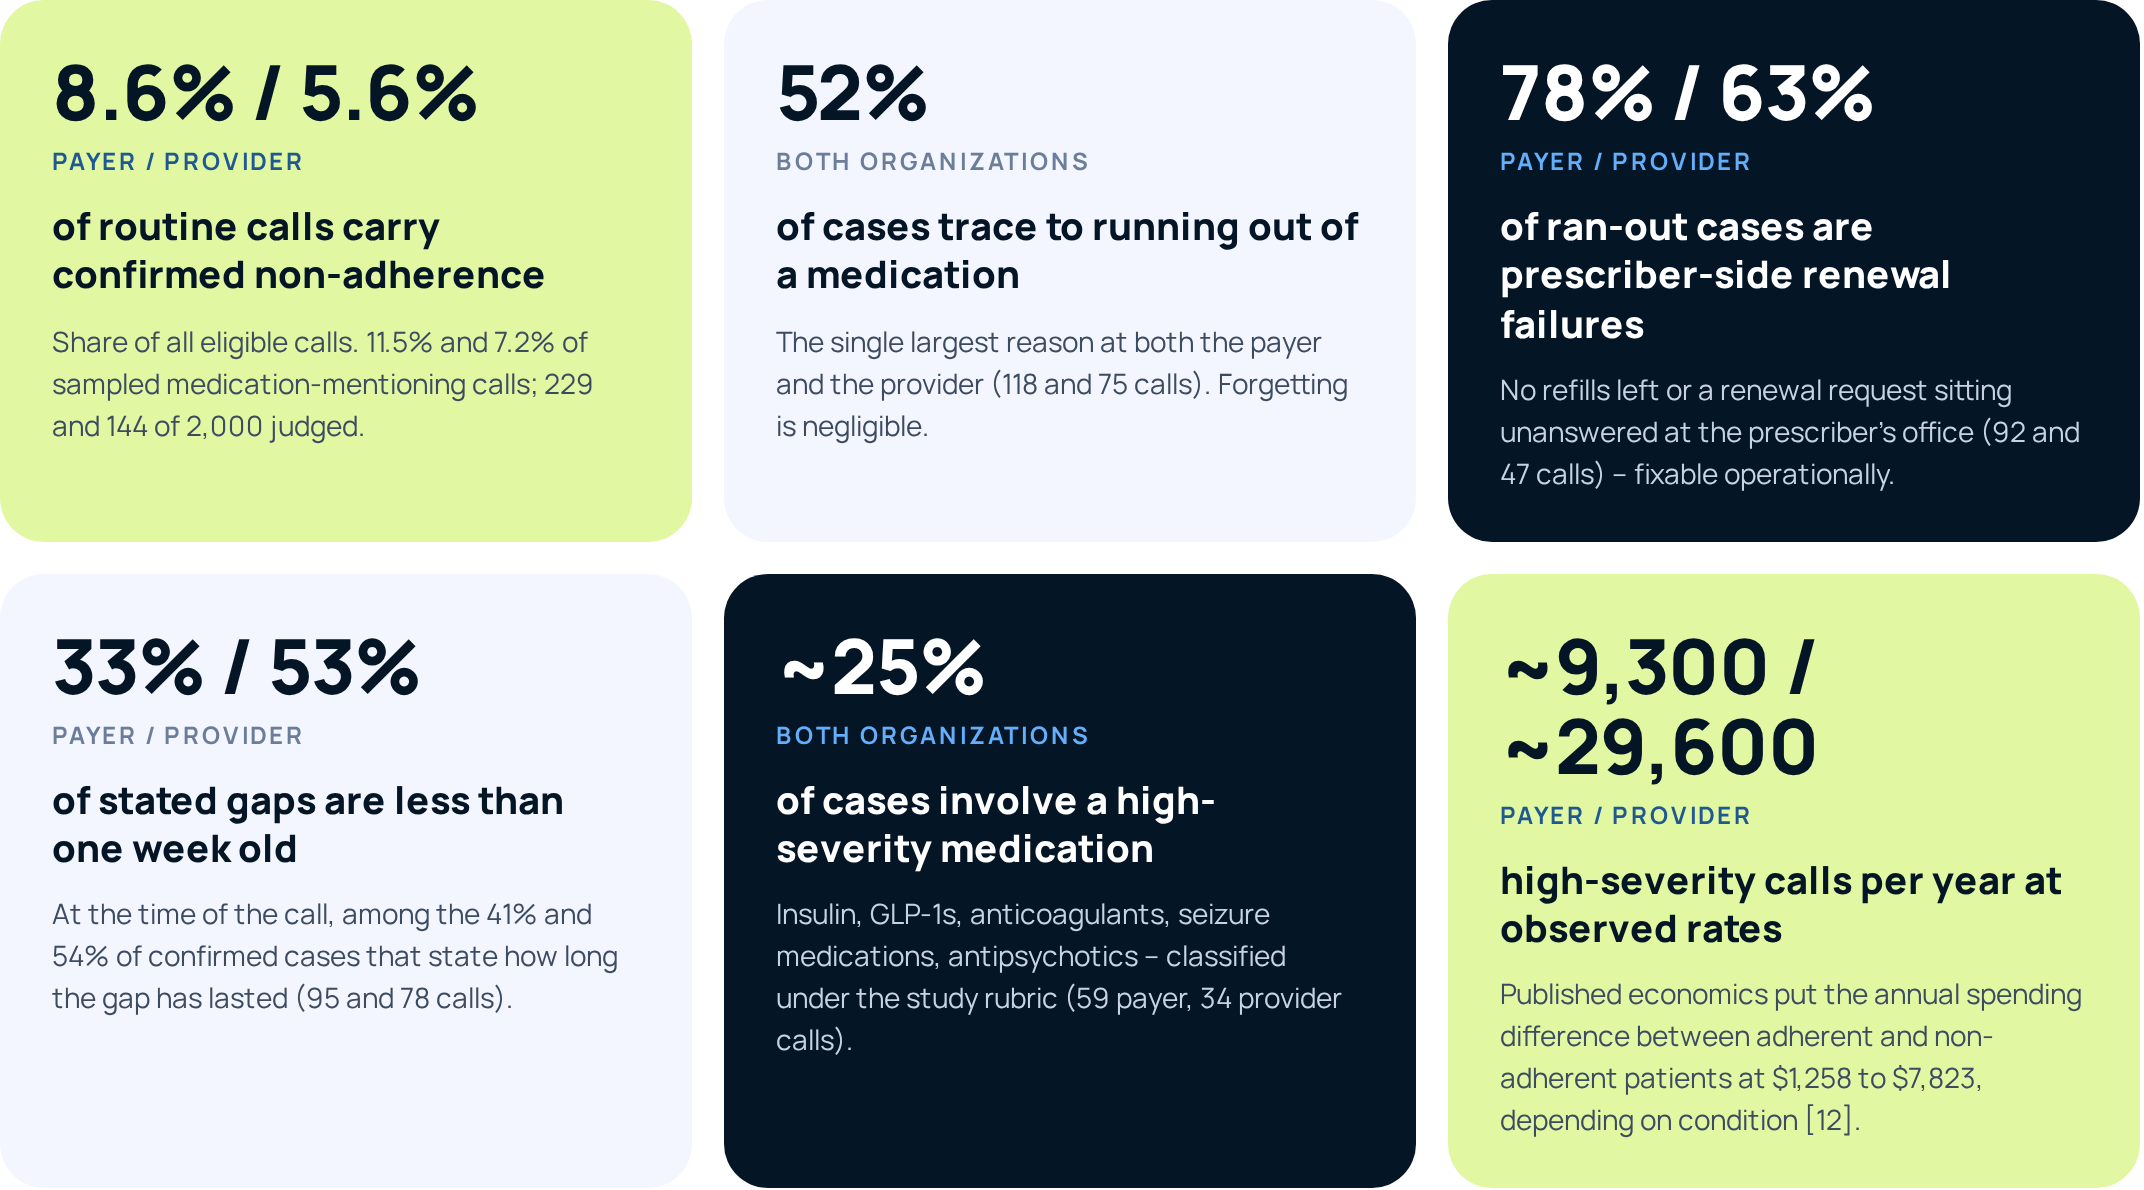
Genuine medication non-adherence was confirmed on 11.5% of the payer’s medication-mentioning calls and 7.2% of the provider’s - an estimated 8.6% and 5.6% of all eligible calls, a ratio of about 1.5 to 1. The payer's higher rate reflects its call mix, not a difference in member behavior: 57% of its confirmed cases (131 of 229) arose on calls placed by its medication-adherence and pharmacy outreach teams, where non-adherence is confirmed on 39.8% of sampled medication-mentioning calls (131 of 329). The remaining 98 cases surfaced passively, on calls about scheduling, benefits, care management, and enrollment, at a 5.9% rate (98 of 1,671) comparable to the provider’s 7.2%, where no adherence-outreach program exists. Passive detection on routine calls is a consistent property of both streams; targeted adherence calls add yield on top of it.
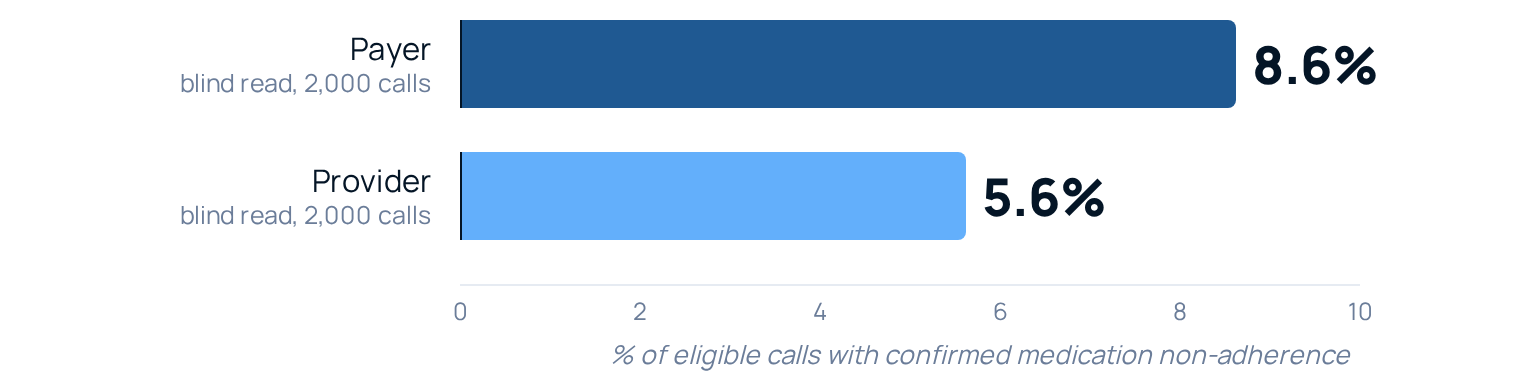
Figure 1. Confirmed medication non-adherence as a share of eligible calls, by organization.
3.2 Case illustration
On a routine provider call, an insulin-dependent member discloses a clinically urgent gap directly during the call:
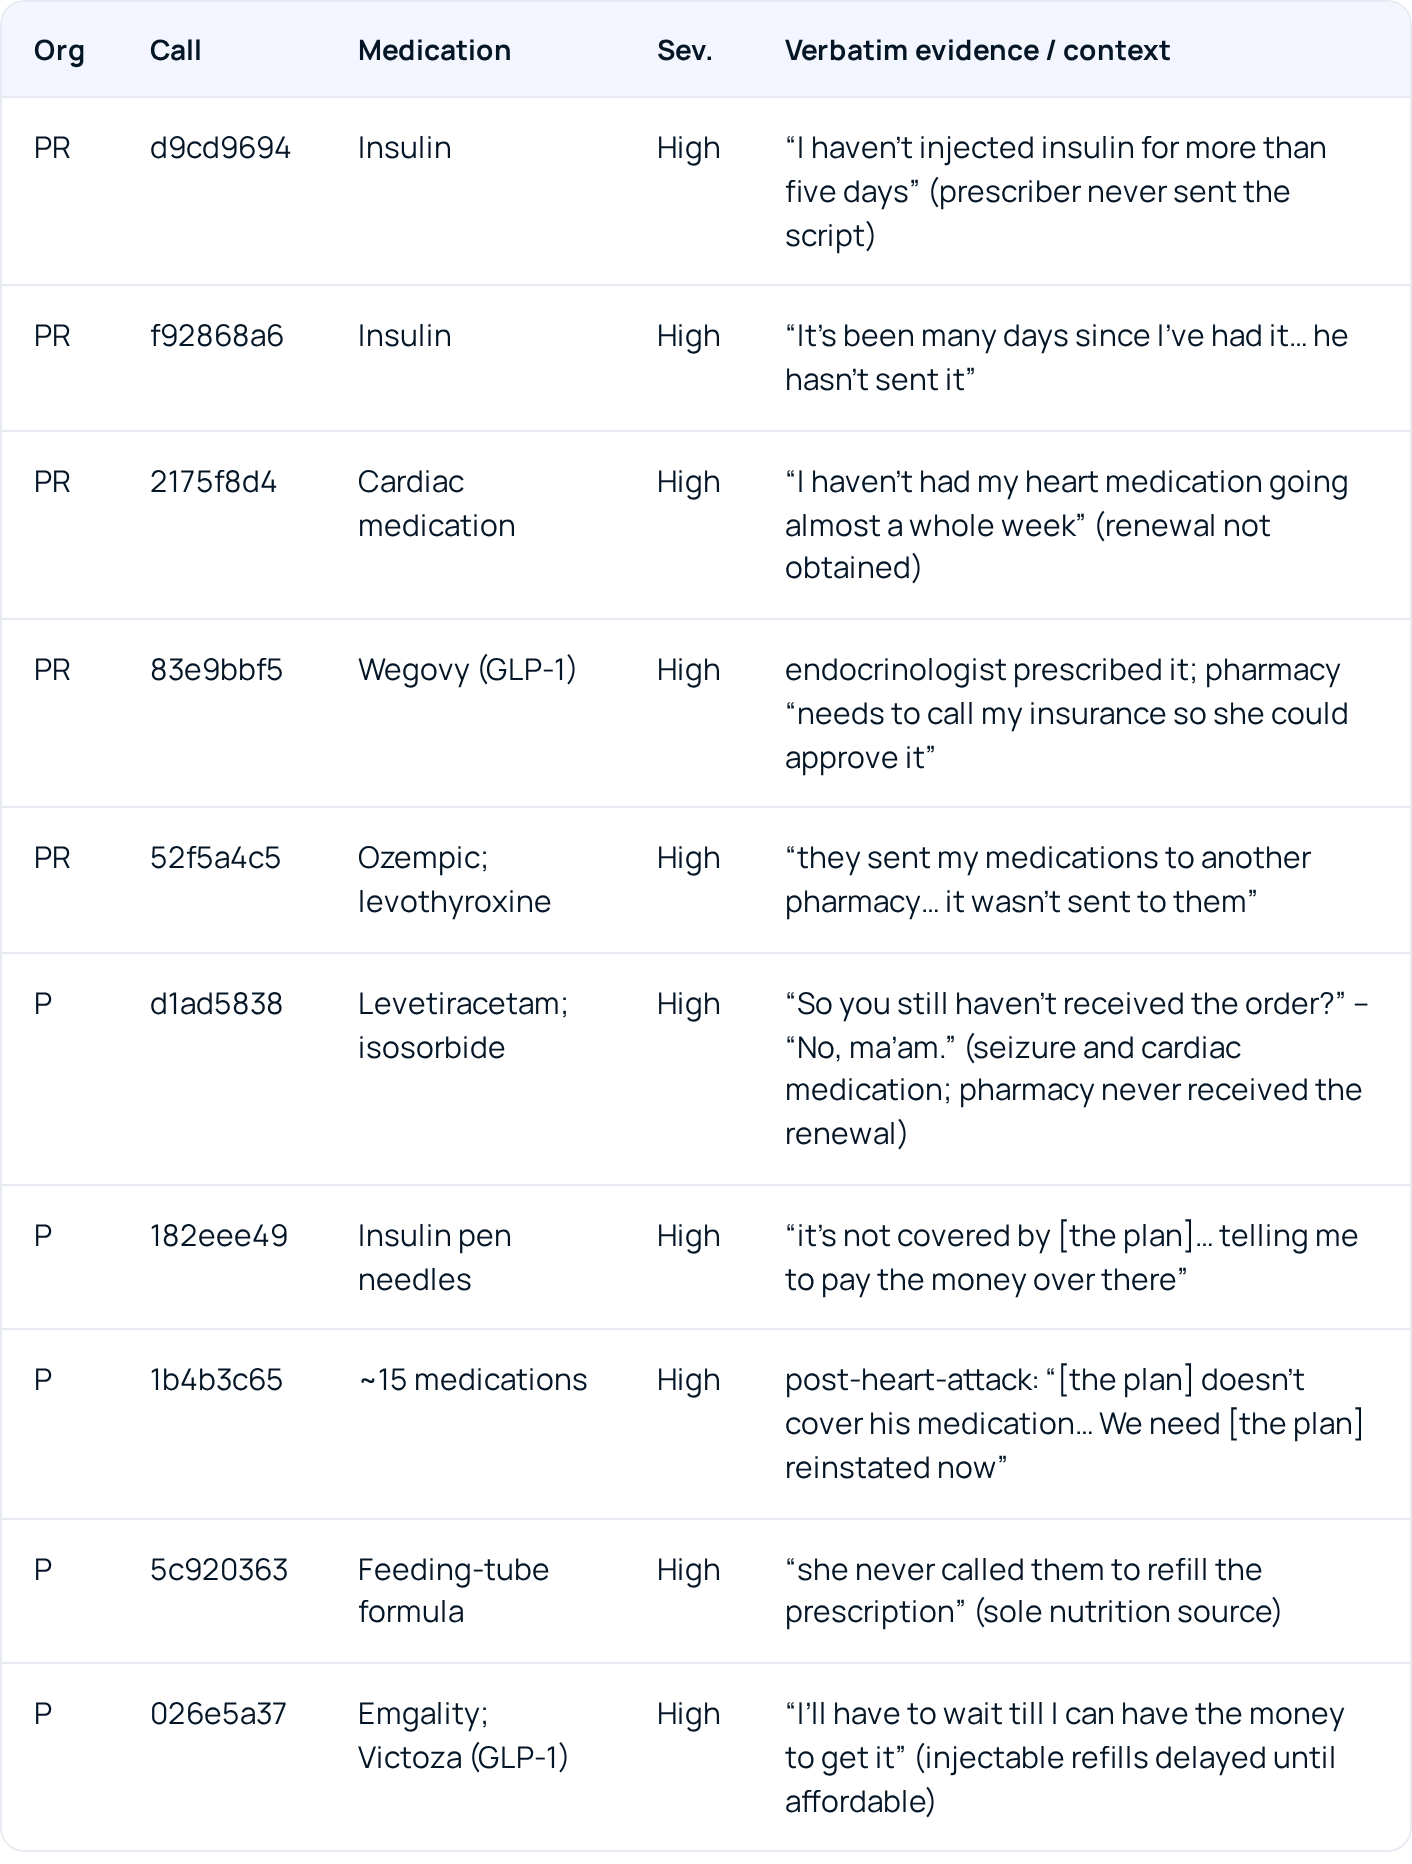
“It's been a big deal for me because I don't have medicine for my sugar. I haven't injected insulin for more than five days.” (the pharmacy confirms the prescriber never transmitted the script; provider call d9cd9694; Insulin; severity High)
No screening instrument and no claims signal were involved; the member stated the problem, its duration, and its cause in three sentences. Cases of this kind - an acute gap with a stated cause and a clear operational fix - recur throughout both samples.
3.3 What drives non-adherence
Running out of medication is the single largest reason at both organizations: 52% of both the payer's and the provider's confirmed cases. Cost and coverage barriers are next at the payer (18%); at the provider, pharmacy and delivery failures account for 22%. Forgetting, the behavior that reminder-based adherence programs target, is negligible in both samples.
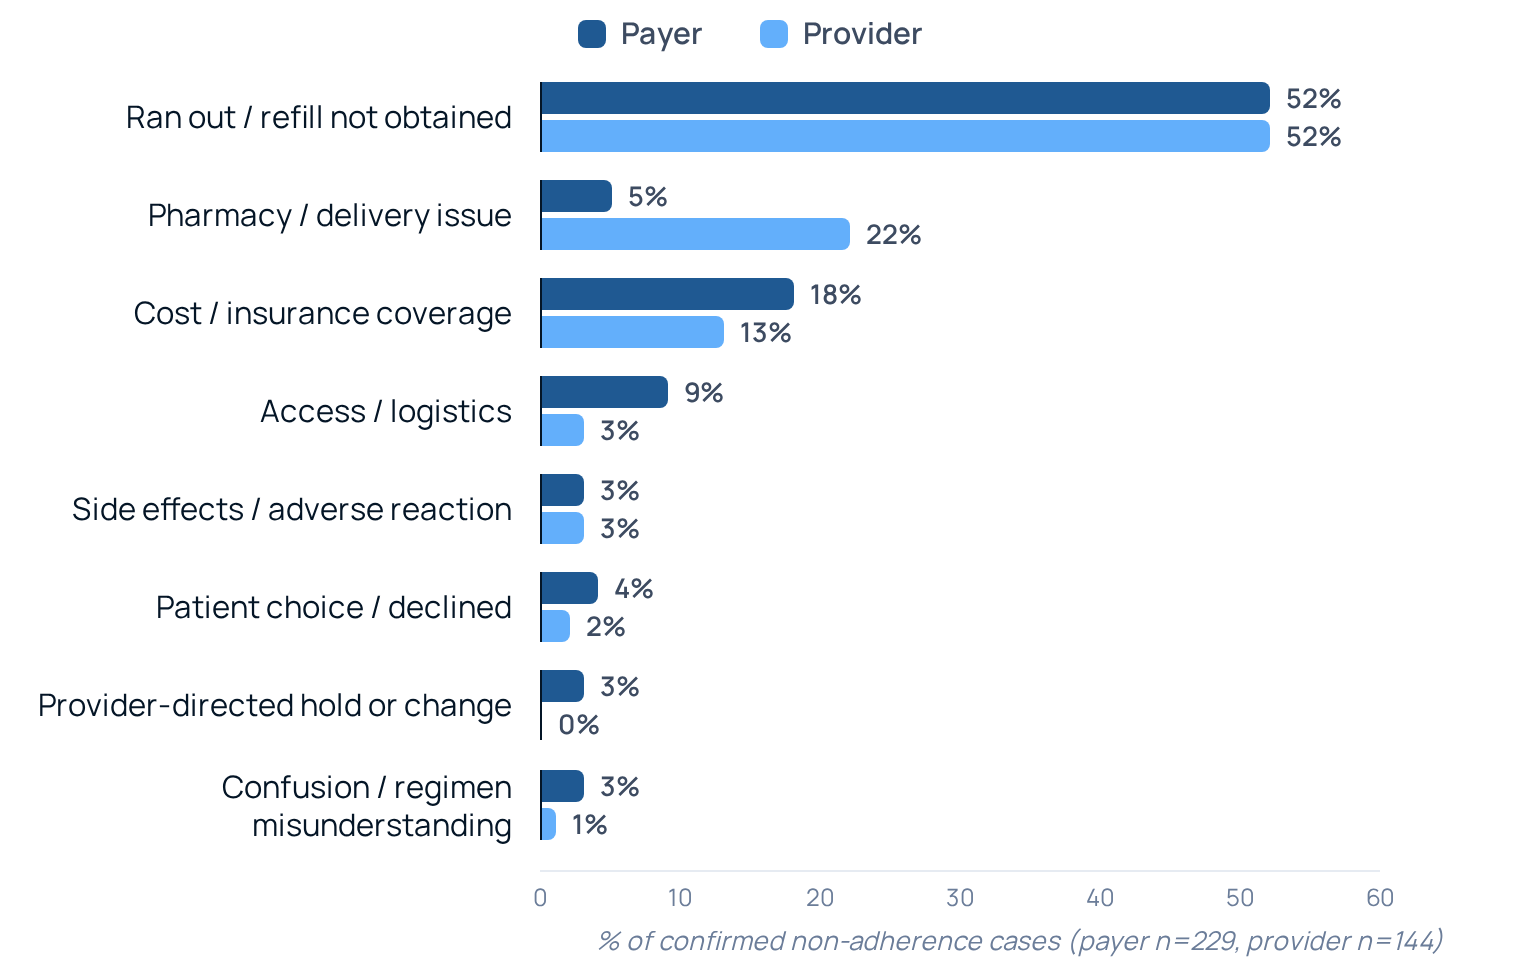
Figure 2. Primary reason for non-adherence among confirmed cases, by organization. Full counts in Appendix A.
A second, independent read of all 193 ran-out cases (118 payer, 75 provider) found that the bucket does not redistribute into the other reason categories: 94% (182 of 193) have no equivalent in the conventional reason taxonomy, and cost never appears as the underlying cause. The dominant mechanism is prescriber-side renewal failure: 78% of the payer's ran-out cases (92 of 118) and 63% of the provider's (47 of 75). In 68 payer and 32 provider cases the prescription was exhausted with no refills left; in a further 24 and 15, a renewal request was already sitting unanswered at the prescriber's office. Fills that were ready but never collected account for 14% and 8%, and 5% and 16% state no underlying cause. For members who ran out, the problem is predominantly a prescription-renewal and prescriber-handoff failure the organization can fix operationally, rather than a failure of member motivation.
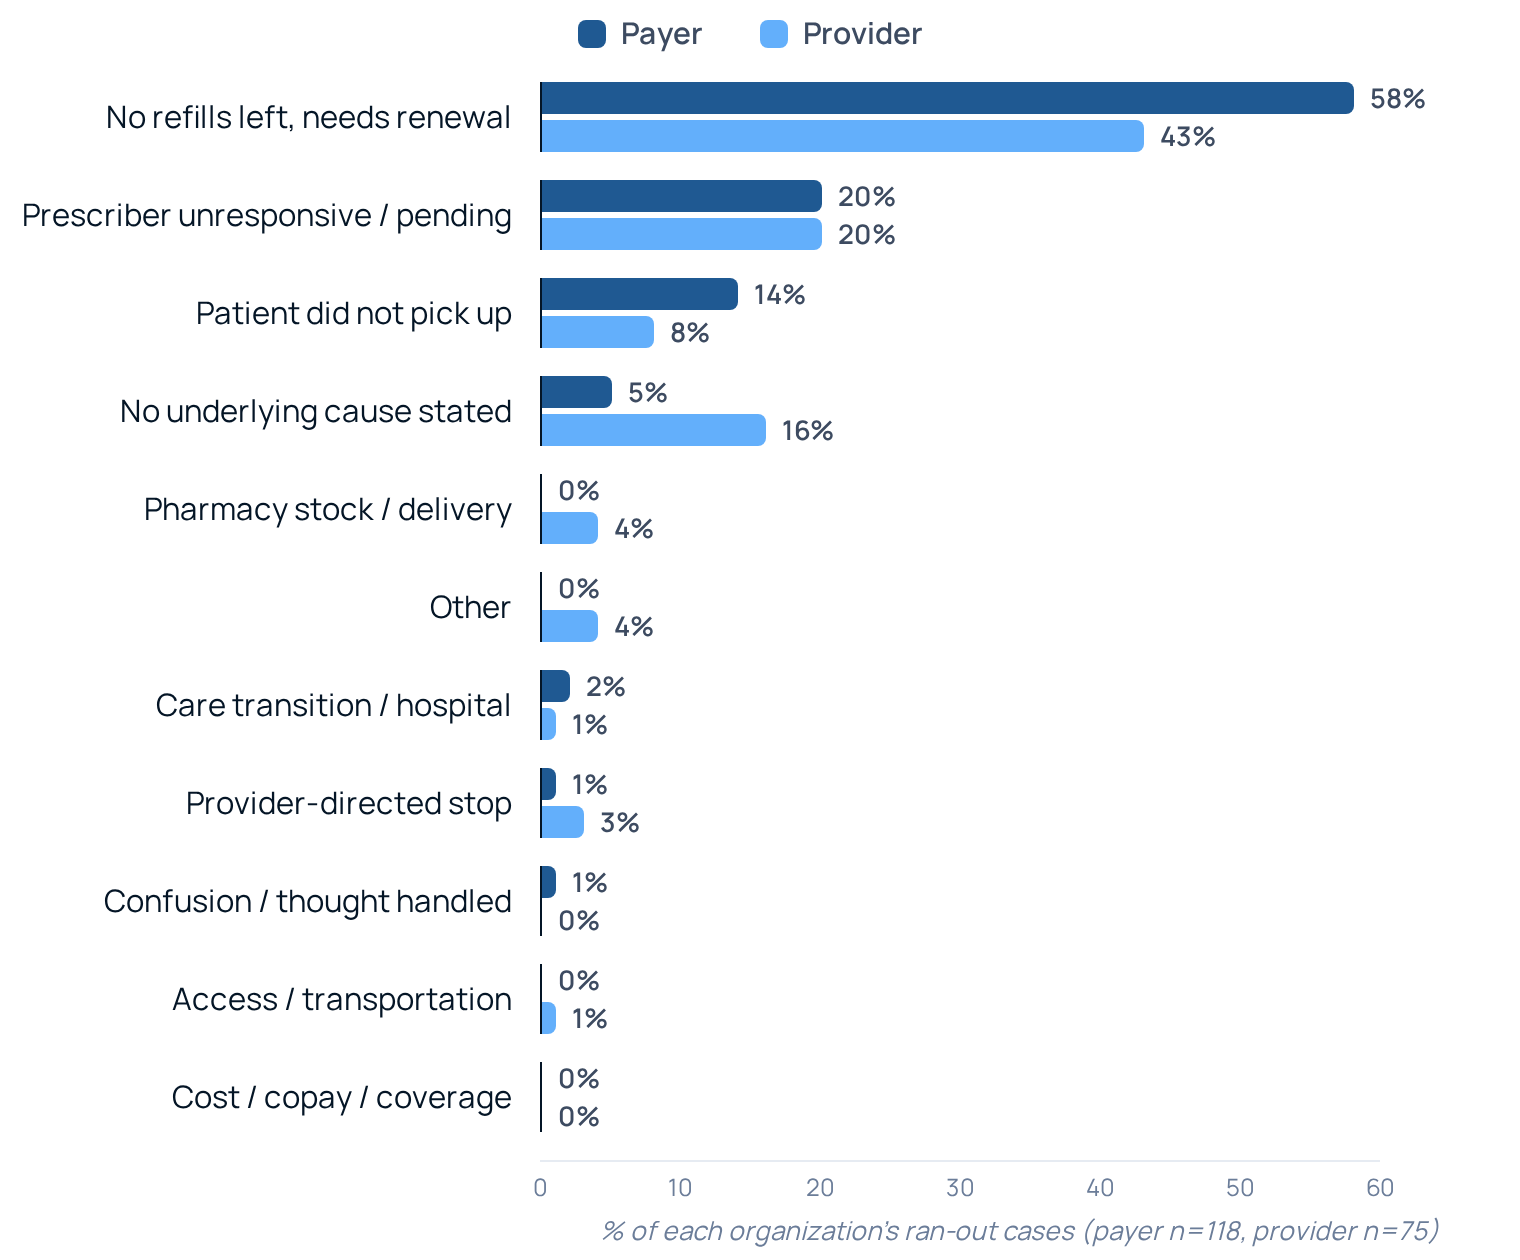
Figure 3. Underlying cause of the 193 ran-out cases across the two samples (118 payer, 75 provider) on a second, independent read, as a share of each organization’s ran-out cases.
“The lisinopril, we sent a refill back in February. No response yet.” - “Oh, and it’s April?” (pharmacy confirming an unanswered renewal request on a payer outreach call; lisinopril and atorvastatin; 33fa53e4)
3.4 How early it is caught
A duration is stated in 41% of the payer's confirmed cases (95) and 54% of the provider's (78). Among them, 33% of the payer's and 53% of the provider's involved gaps of less than one week at the time of the call. At the provider this is the largest single group; at the payer, ongoing or intermittent lapses are slightly larger (35%). The remainder ranges from weeks-old gaps to longer-running lapses.

Figure 4. Stated duration of the medication gap, as a share of the cases where a duration was stated, by organization.
3.5 How severe it is
A specific medication was identified in 96% of the payer's confirmed cases and 92% of the provider's. High-severity cases (insulin and GLP-1 injectables, anticoagulants, cardiac and seizure medications, antipsychotics) account for 26% of the payer's confirmed cases and 24% of the provider's. At both organizations, cost and coverage barriers are disproportionately high-severity: 48% of the payer's cost cases (20 of 42) and 37% of the provider's (7 of 19) were graded high, against 26% and 24% overall, because they block the expensive, high-stakes drugs (GLP-1s, specialty and tier-5 products, insulin supplies). So although cost is a minority of cases by volume, it is the most dangerous driver per case.
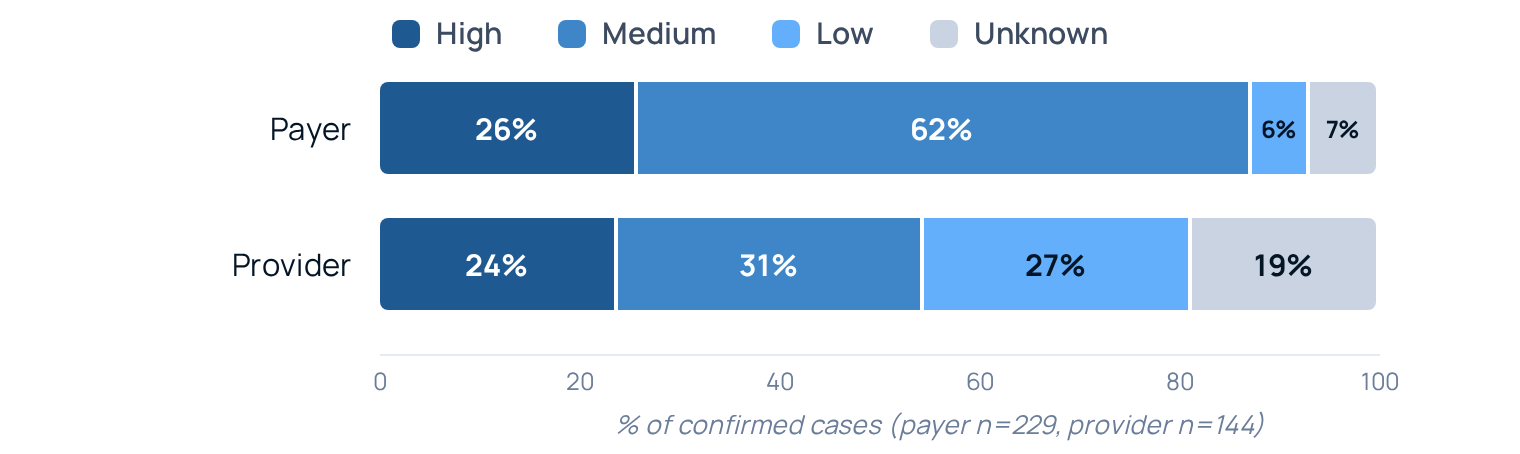
Figure 5. Clinical severity of the missed medication among confirmed cases, by organization.
“they said that it’s not covered by [the plan]… they are telling me to pay the money over there.” (payer member unable to obtain insulin pen needles; 182eee49; severity High)
3.6 The scale of the detected signal
Each organization’s observed eligible call volume is scaled linearly to a full year, then the detection rates from Section 3.1 and the high-severity shares from Section 3.5 are applied; the result is a volume of detected calls, not unique members. For context, a widely cited observational study of four chronic vascular conditions estimated $1,258 to $7,823 lower annual health care spending among adherent patients, depending on the condition [12]. This paper stops at volume and published benchmarks; an organization-specific savings estimate requires member-level linkage (caveats in Appendix C).
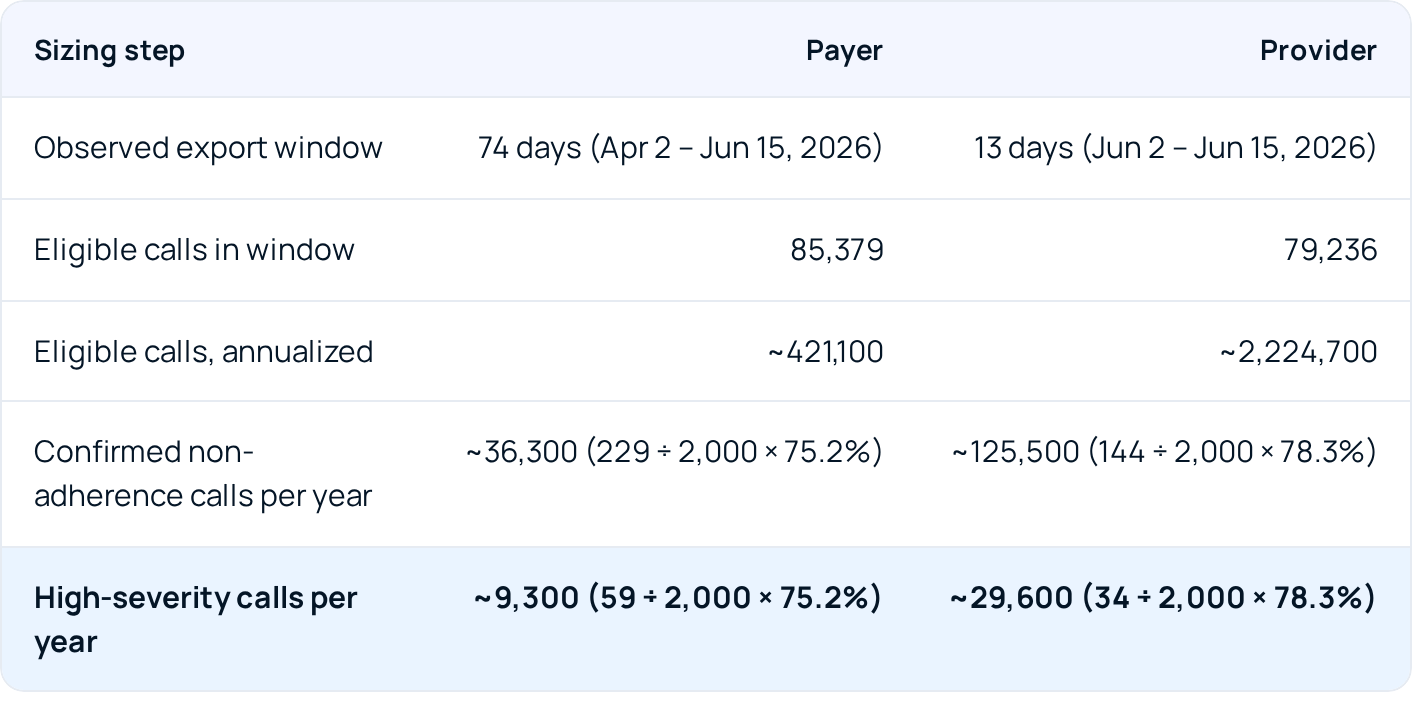
Annualized volumes are illustrative extrapolations from the observed windows, not forecasts or counts of unique members; the provider estimate is particularly sensitive to the representativeness of its 13-day window. Percentages in this paper may not total 100% because of rounding.
4. Discussion
Why the two rates differ. The payer's rate is about 1.5 times the provider's; the clearest explanation is call mix rather than member behavior (Section 3.1). Neither number is a member-level adherence rate; both measure how often non-adherence is expressed on a call.
Regulatory and commercial relevance. The three Part D adherence measures are triple-weighted in the 2026 Star Ratings [8,9], and because they are computed from proportion of days covered, intervening before a fill gap widens is a direct rating and revenue lever for a plan [5,7]. Conversational detection surfaces the gap while it is occurring, often earlier than the claim, and attaches a cause, which determines the intervention: a cost case needs a copay or formulary fix [6], a prescriber-renewal case needs a fax chased, a side-effect case needs a clinical call. The transcript itself does not feed the PDC numerator, which is computed from claims. One boundary: the Part D diabetes measure excludes members on insulin, and anticoagulants, seizure medications, and antipsychotics sit outside the three measures, so the clinical reach of conversational detection is broader than the Star measures and the direct Star opportunity narrower than the total high-severity volume.
How this compares with existing detection channels. Claims-based PDC measures run over a 12-month measurement year and require at least two fills, so they never see primary non-adherence: in a 2010 analysis of 195,930 e-prescriptions, 28.3% were never filled [9,18]. Refill-gap programs are reactive by design; in a large randomized study of 735,218 Medicare beneficiaries, outreach was triggered three days after the supply had run out [20]. In a 2010 meta-analysis, self-report overstated adherence by about nine percentage points [21]. Medication-therapy-management enrollment averaged about 10% of Part D beneficiaries in 2012 [22], and plan-run telephonic care management engaged 13% of targeted patients [23]. The conversational channel inverts each constraint: it passively covers every recorded call rather than an enrolled subset, captures the gap while it is occurring, and attaches the member-stated cause no claims measure carries [10].

5. Conclusion
Across individually judged member calls at a health plan and a provider organization, medication non-adherence surfaces in the routine call stream at a measurable, clinically meaningful rate (an estimated 8.6% of the payer’s calls and 5.6% of the provider’s), dominated not by patient forgetfulness but by prescription-renewal, pharmacy-fulfillment, and coverage failures the organization is positioned to fix, and disclosed exactly where the member is on the line. Where a duration is stated, 33% and 53% of cases describe a gap of less than one week, and the volume is material: roughly 9,300 high-severity calls per year in the payer’s stream and 29,600 in the provider’s. The routine call stream is an always-on medication-adherence sensor hiding in plain sight; the organizations that listen to it systematically will find, with member’s-own-words evidence, the gaps their quality measures already hold them accountable for.
Appendix A. Results Tables
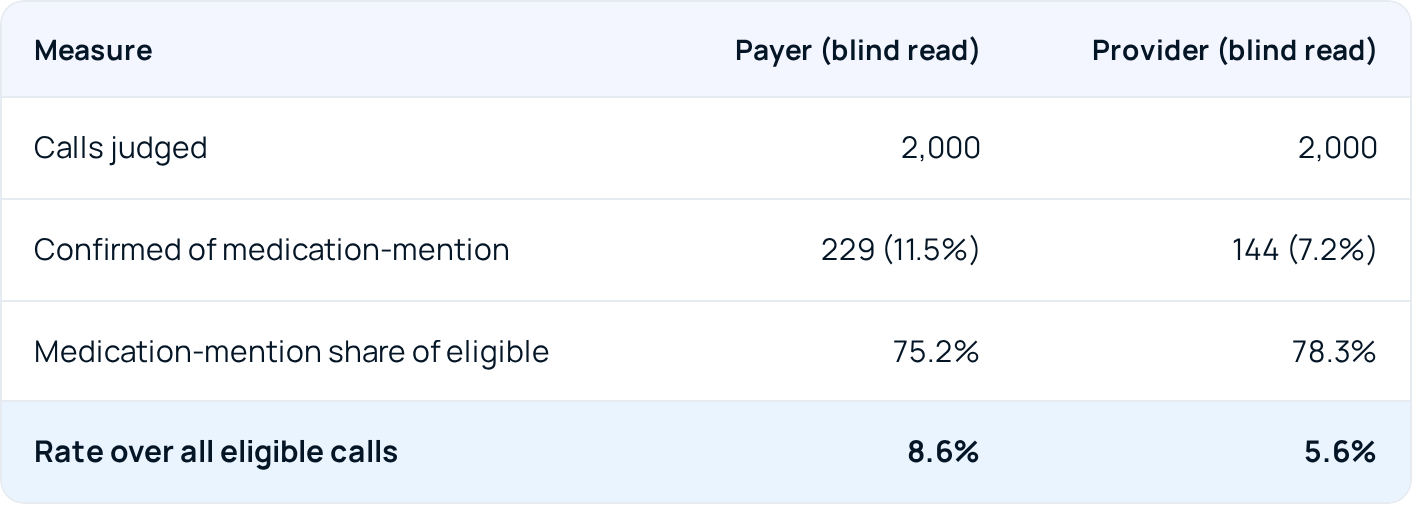
Table A1. Detection.
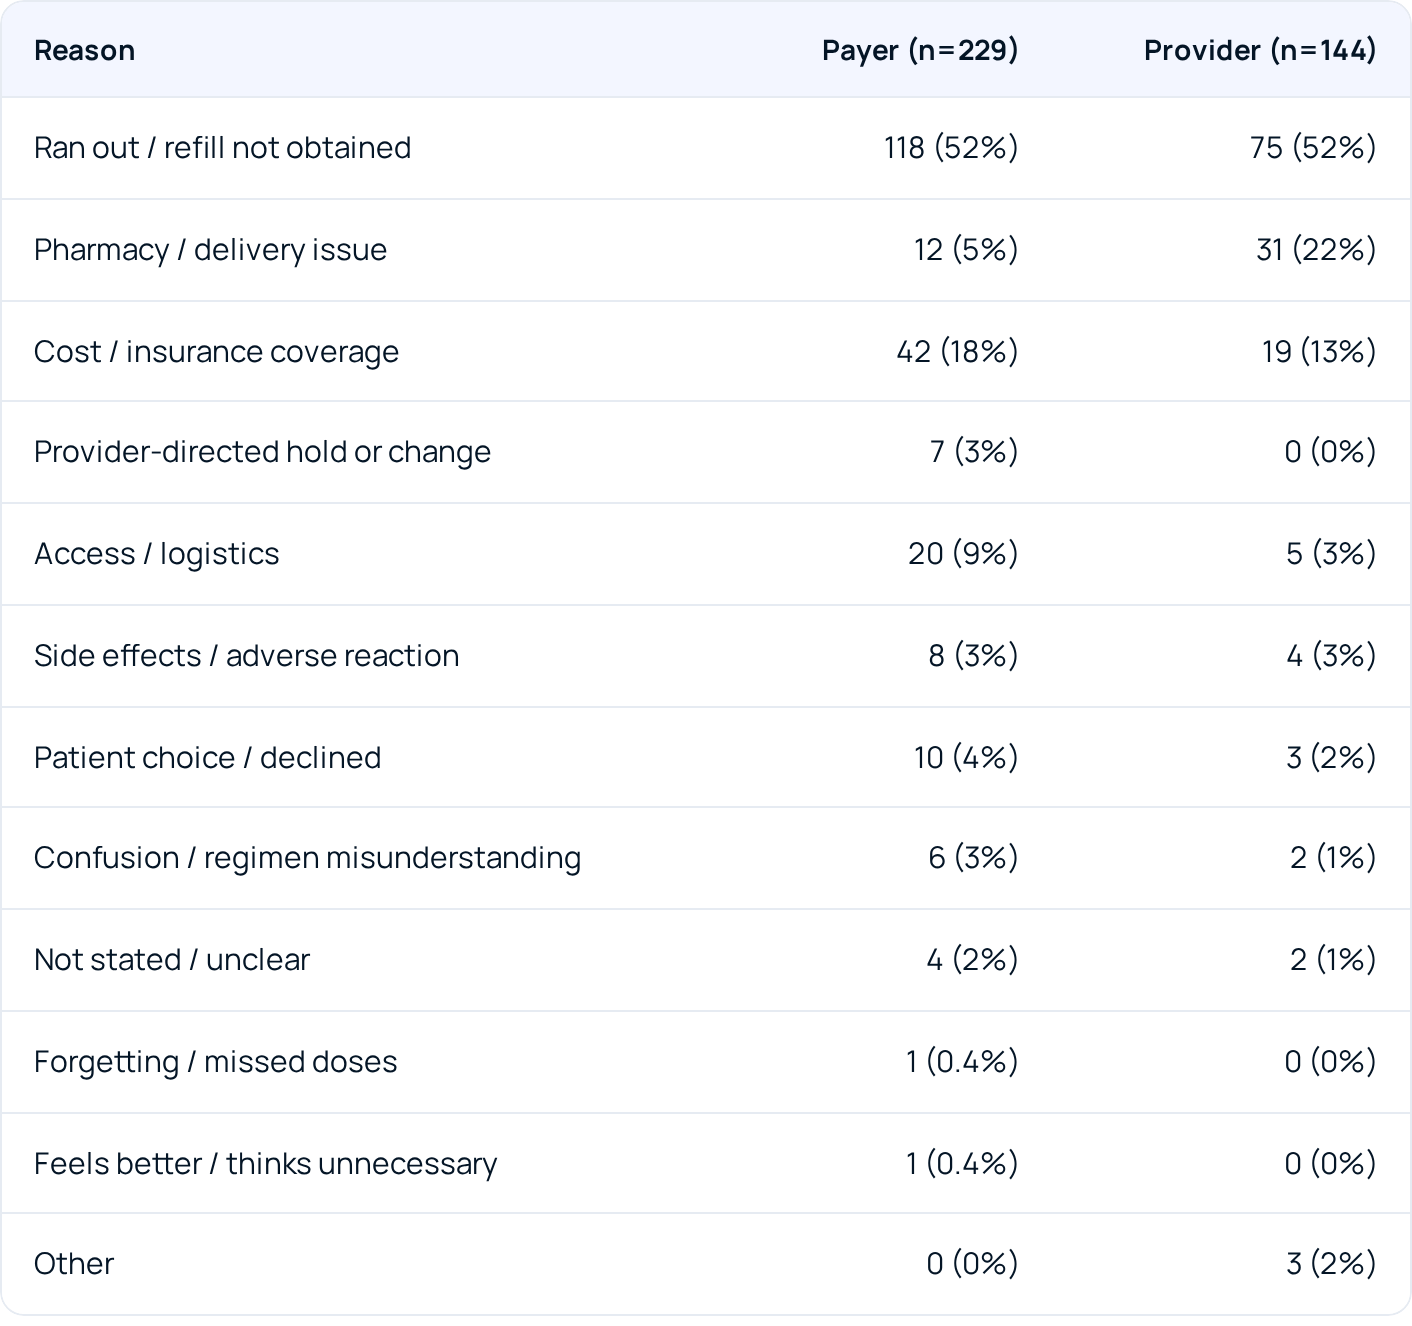
Table A2. Primary reason among confirmed cases.
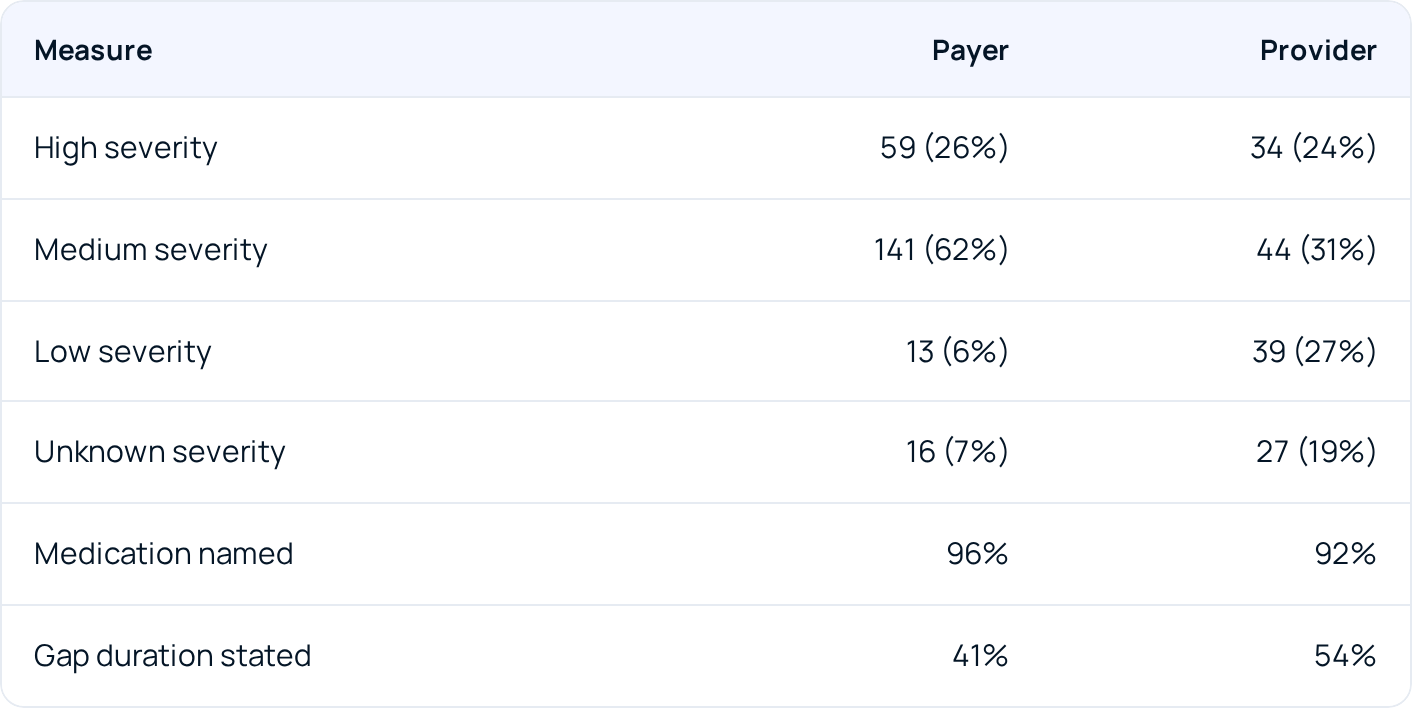
Table A3. Severity and time frame among confirmed cases.
Severity percentages may not total 100% because of rounding.
Appendix B. Selected Verbatim Cases
Confirmed non-adherence cases with verbatim transcript evidence. P = payer, PR = provider.
Appendix C. Method Detail, Sizing Caveats, and Limitations
Judgment and rubric. Judgment proceeded one 50-call batch at a time under a fixed rubric. Reason was assigned from a 13-category vocabulary (cost/insurance; side effects; ran out/refill not obtained; pharmacy/delivery; forgetting; patient choice/declined; feels better/unnecessary; provider-directed hold or change; confusion/regimen misunderstanding; access/logistics; clinical event; other; not stated) plus a false-positive category (no non-adherence evident). Severity graded the clinical risk of interruption for the specific medication and patient (High: insulin and diabetes injectables, anticoagulants, cardiac/antiarrhythmic, seizure, antipsychotic, immunosuppressant, mid-course antibiotic, severe-COPD/asthma inhaler, chemotherapy, opioid-dependence; Medium: antihypertensives, statins, metformin, antidepressants, thyroid; Low: vitamins, supplements, OTC, topical, non-critical PRN; Unknown otherwise).
Sizing inputs (Section 3.6). Eligible calls 85,379 (payer, April 2 to June 15, 2026, 74 elapsed days) and 79,236 (provider, June 2 to June 15, 2026, 13 elapsed days); medication-mention shares 75.2% and 78.3%; confirmed cases 229 and 144; high-severity cases 59 and 34. Annualized volume = eligible calls ÷ elapsed days × 365 × cases ÷ 2,000 × medication-mention share, rounded only at the final step.
Quality control. Every non-empty evidence excerpt was verified as an exact substring of its source transcript (0 accepted mismatches); batch record counts, call identifiers, and ordering were validated against the source sample; batches failing any check were rejected and re-judged. In excerpts published here, identifying names are replaced with bracketed neutral terms (e.g., [the plan]); verification was performed against the original transcript text. The complete rubric, per-case verbatim evidence, and row-level datasets for both organizations are maintained internally [1,2,3].
Sizing detail and caveats (Section 3.6). Observed eligible call volume was 85,379 calls over the payer’s 74-day export window (April 2 to June 15, 2026) and 79,236 calls over the provider’s 13-day window (June 2 to June 15, 2026), both counted as elapsed days and scaled linearly to a full year. Three caveats bound the sizing. The volumes are call-level and the annualization is linear; the provider’s 13-day window makes its column especially sensitive to whether that fortnight is representative, and it should be read as an illustration of scale, not a forecast. The published benchmarks are context, not a valuation: reference [12] compares adherent with non-adherent patient-years in an observational design, and its figures are not the value of resolving any single detected case. The sizing excludes the Star Ratings channel, where the three adherence measures are triple-weighted in the 2026 Star Ratings [8,9]; for a health plan that quality channel is a separate, plan-specific source of value, and for the provider, avoided medical spend accrues to payers rather than to the provider itself, whose return is in quality performance and panel outcomes. For context on single events: an average hospital stay cost hospitals about $16,700 to produce in 2022 [13], a treat-and-release emergency visit an estimated $1,110 for patients 65 and older in 2021 [14], and a single diabetic-ketoacidosis admission, the acute endpoint of the insulin gaps recurring in both samples, carried mean hospital charges (not costs) of $26,566 in 2014 [15]. At the US health system level, non-adherence was estimated to drive $105 billion in avoidable annual cost on 2012 data [16], and full adherence among hypertensive Medicare fee-for-service beneficiaries alone was modeled to save $13.7 billion a year [17]. Among Medicare patients, chronic-medication non-adherence is separately associated with $679 to $898 in additional preventable spending among patients with at least one preventable encounter [7].
Limitations. Two organizations in two regions with English/Spanish-dominant call streams; judgments were made by large-language-model analysts under a fixed rubric, without systematic human re-adjudication of a random subset; the exact-substring verification validates the quoted evidence, not the classification itself; and borderline routine-refill calls sit on a soft boundary between “no non-adherence” and “not stated.” Confirmed-case counts (229 payer, 144 provider) support the primary breakdowns, but sub-category percentages, particularly the provider's, carry wide uncertainty. Call-level detection measures expressed non-adherence, not total prevalence: members who never call, or never mention a gap, are not counted, so the per-call yields reported here are not member-level prevalence estimates and should not be compared with them. Separately, seven payer cases carry a primary reason of provider-directed hold or change; on re-read, five are clinician-directed holds that a stricter definition of non-adherence would exclude, while two involve an active, unresolved medication gap. Excluding the five would lower the payer’s confirmed count to 224 (11.2% of medication-mentioning calls; an estimated 8.4% of eligible calls). The ran-out decomposition rests on all 193 ran-out cases in the two samples (118 payer, 75 provider); its sub-category percentages carry wider uncertainty than the headline rates. Severity is a classification under the study rubric, not an observed clinical outcome.
References
- Popai Health. Medication non-adherence judged-call dataset, payer (Payer_Med_NonAdherence_Analysis) and blind-read validation sample. Internal analysis, 2026.
- Popai Health. Medication non-adherence judged-call dataset, provider (Provider_Med_NonAdherence_Analysis_2000). Internal analysis, 2026.
- Popai Health. Medication non-adherence definitions, severity rubric, and blind-read judgment methodology. Internal, 2026.
- Foley L, Larkin J, Lombard-Vance R, et al. Prevalence and predictors of medication non-adherence among people living with multimorbidity: a systematic review and meta-analysis. BMJ Open. 2021;11:e044987.
- Watanabe JH, McInnis T, Hirsch JD. Cost of Prescription Drug-Related Morbidity and Mortality. Annals of Pharmacotherapy. 2018;52(9):829-837. ($528.4B in 2016 USD from non-optimized medication therapy, ~16% of US health expenditure.) doi:10.1177/1060028018765159; PMID 29577766
- National Center for Health Statistics (CDC). Characteristics of Adults Aged 18-64 Who Did Not Take Medication as Prescribed to Reduce Costs: United States, 2021. NCHS Data Brief No. 470. Hyattsville, MD; 2023. (8.2% of adults aged 18-64 who took prescription medication did not take it as prescribed to reduce costs.) cdc.gov/nchs/products/databriefs/db470.htm
- Zhang Y, et al. Chronic Medication Nonadherence and Potentially Preventable Healthcare Utilization and Spending Among Medicare Patients. Journal of General Internal Medicine. 2022. (Nonadherence associated with a 1.0 to 1.7 percentage-point higher probability of potentially preventable hospitalization or ED use, and $679 to $898 higher preventable spending per affected patient, 2016 dollars.) doi:10.1007/s11606-021-07334-y
- Centers for Medicare & Medicaid Services. Medicare 2026 Part C & D Star Ratings Technical Notes. 2025. (Three PDC medication-adherence measures are triple-weighted: diabetes, hypertension/RASA, cholesterol/statin. Finalized specification updates reduce the three measures to single weight for the 2028 Star Ratings, measurement year 2026, before an expected return to triple weight.) cms.gov/files/document/2026-star-ratings-technical-notes.pdf
- Pharmacy Quality Alliance (PQA). PQA Adherence Measures: Proportion of Days Covered (PDC). Measure implementation documentation. pqa.org/measures
- Guevara M, Chen S, Thomas S, et al. Large language models to identify social determinants of health in electronic health records. npj Digital Medicine. 2024;7:6. (Unstructured clinical text carries determinant/clinical signal that structured data misses.) doi:10.1038/s41746-023-00970-0
- Grand View Research. AI Voice Agents In Healthcare Market Report, 2025-2030. 2025. (Appointment scheduling and prescription-refill handling are leading applications; ~38% CAGR.) grandviewresearch.com/industry-analysis/ai-voice-agents-healthcare-market-report
- Roebuck MC, Liberman JN, Gemmill-Toyama M, Brennan TA. Medication Adherence Leads to Lower Health Care Use and Costs Despite Increased Drug Spending. Health Affairs. 2011;30(1):91-99. (Annual total health care savings per adherent patient: CHF $7,823, hypertension $3,908, diabetes $3,756, dyslipidemia $1,258; 1.2 to 5.7 fewer inpatient days per year.) doi:10.1377/hlthaff.2009.1087
- Agency for Healthcare Research and Quality. National Inpatient Hospital Costs: The Most Expensive Conditions by Payer, 2022. HCUP Statistical Brief No. 316; 2026. ($548.5 billion in aggregate hospital costs across 32.9 million stays; about $16,700 per stay, derived.) hcup-us.ahrq.gov/reports/statbriefs/sb316-most-expensive-conditions-by-payer-2022.pdf
- Agency for Healthcare Research and Quality. Costs of Treat-and-Release Emergency Department Visits in the United States, 2021. HCUP Statistical Brief No. 311; 2024. (Average cost $750 per visit; $1,110 for patients 65 and older.) hcup-us.ahrq.gov/reports/statbriefs/sb311-ED-visit-costs-2021.pdf
- Desai D, Mehta D, Mathias P, Menon G, Schubart UK. Health Care Utilization and Burden of Diabetic Ketoacidosis in the U.S. Over the Past Decade: A Nationwide Analysis. Diabetes Care. 2018;41(8):1631-1638. (Mean hospital charges of $26,566 per DKA admission in 2014.) doi:10.2337/dc17-1379
- IMS Institute for Healthcare Informatics (now IQVIA Institute). Avoidable Costs in U.S. Healthcare: The $200 Billion Opportunity from Using Medicines More Responsibly. 2013. (Non-adherence responsible for an estimated $105.4 billion in annual avoidable cost, 2012 data. The report’s counts of 10 million avoidable admissions and 4 million avoidable ED visits apply to all six levers of suboptimal medication use combined, an estimated $213 billion.)
- Lloyd JT, Maresh S, Powers CA, Shrank WH, Alley DE. How Much Does Medication Nonadherence Cost the Medicare Fee-for-Service Program? Medical Care. 2019;57(3):218-224. (Full adherence among hypertensive beneficiaries would save an estimated $13.7 billion annually and avert over 100,000 ED visits and 7 million inpatient days.)
- Fischer MA, Stedman MR, Lii J, et al. Primary Medication Non-Adherence: Analysis of 195,930 Electronic Prescriptions. Journal of General Internal Medicine. 2010;25(4):284-290. (28.3% of new e-prescriptions were never filled; 31.4% for diabetes medications.) doi:10.1007/s11606-010-1253-9
- Lauffenburger JC, Fontanet CP, Isaac T, et al. Comparison of a New Three-Item Self-Reported Measure of Adherence to Medication with Pharmacy Claims Data in Patients with Cardiometabolic Disease. American Heart Journal. 2020;228:36-43. (Administrative lag in claims data limits real-time decision-making.) doi:10.1016/j.ahj.2020.06.012
- Taitel MS, Mu Y, Gooptu A, Lou Y. Impact of Late-to-Refill Reminder Calls on Medication Adherence in the Medicare Part D Population: Evaluation of a Randomized Controlled Study. Patient Preference and Adherence. 2017;11:373-379. (Refill-gap outreach in a 735,218-patient trial triggered 3 days after the days supply was exhausted.) doi:10.2147/PPA.S127997
- Shi L, Liu J, Fonseca V, et al. Correlation Between Adherence Rates Measured by MEMS and Self-Reported Questionnaires: A Meta-Analysis. Health and Quality of Life Outcomes. 2010;8:99. (Self-reported adherence 84.0% versus 74.9% by electronic monitoring; pooled r=0.45.) doi:10.1186/1477-7525-8-99
- Stuart B, Hendrick FB, Shen X, et al. Eligibility for and Enrollment in Medicare Part D Medication Therapy Management Programs Varies by Plan Sponsor. Health Affairs. 2016;35(9):1572-1580. (MTM enrollment averaged 10% in 2012.) doi:10.1377/hlthaff.2016.0258
- Annis AM, Holtrop JS, Tao M, Chang HC, Luo Z. Comparison of Provider and Plan-Based Targeting Strategies for Disease Management. American Journal of Managed Care. 2015;21(5):344-351. (Plan-delivered telephonic care management engaged 13% of targeted patients, versus 50% for provider-delivered.)
.png)